Prostitution in the US: Ethnicity

Note: This is the second of several installments. Part 1 explored the dataset, Part 2 (this part) looks at the ethnicity of sex workers, part 3 looks at the services performed and how this correlates to ethnicity, part 4 looks at the economic side of things and how fees correlate to ethnicity, services and looks of sex workers.
Time has come to take a look at ethnicity. A cursory look reveals that the dataset has a long tail of inconsistent values. This makes sense. We can imagine that those reviewers did not use a ton of time to get ethnicity right. Did they simply mean “black race” when they picked African American? Or did they really mean a born and raised African American:
plt.figure(figsize=(10,9))
# limiting the "long tail" at top 30, it's very very long
frame['Ethnicity'].value_counts()[:30].plot(kind="barh");
Figuring out ‘ethnicity’ across race and geography
Ethnicity poses several problems as it mixes races, geography and culture. Also, it is highly likely that many “reviewers” are not aware of geography (particular the one of continents on the other side of the Atlantic ocean, and this goes both ways).
The TER reviewer form did not offer “black” as an option, opting for the more politically correct ‘African American’, which reviewers obviously picked without much discussion also in those cases where the ‘provider’ was simply black, but not American.
Also some Americans may refer to an “Italian” type of woman, while a European reviewer would make no mistake and define a provider “Italian” only in those cases where she was effectively Italian-born and raised.
“Native American” is also an expression that has generated significant confusion among reviewers in my opinion. Some may certainly have used that in the original sense of the term (what people referred to as “Indians” before political correctness kicked in), but it is obvious that other still have used Native American as a way to identify providers that are “born and raised” American, as their English native proficiency would immediately give away.
Where do we go from here? I figured I would re-group the Ethnicity under EthnicityNormalized, a column that represents a somewhat subjective classification of ethnicity, yet one that should resonate with people on both sides of the Atlantic. Please note that I used geography and language as additional tools to “disambiguate” ethnicity and provide educated guesstimates for each case.
Here’s my categorization.
- White (Americas): white North American, includes some not so white, that still are American born and raised.
- Asian (Americas): Korean (AKA K-girls), Chinese and Japanese.
- Latina (Americas): Coming from South and Central America. May be white or black. Speaks Spanish or Portuguese as her primary language. May or may not speak some English. I further split this category to reflect whether the action took place in North America,
- Black (Americas): African American born and raised, both race and culture. With everything that this implies.
- Eastern Europe (Europe): Eastern Europe has been a significant provider of generally good looking Caucasian sex workers.
- Western Europe (Europe): More rare than their eastern cousins, but they do exist.
- Misc (North America): miscellaneous, as long as it happened in North America.
- Other: whatever didn’t fit in any of the categories above. Data shows an incredibly long combinations of incredible mixes. I could have gone deeper (Indian, Arabic,…), but I had to draw a line somewhere.
Here’s how EthnicityNormalized is coming about.
# Let’s make Ethnicity a little easier to manage and visualize
frame[‘EthnicityNormalized’] = frame.apply(lambda row: normalizedEthnicity(row[‘Ethnicity’],row[‘Country’],row[‘Languages’]), axis=1)
It was a lot of freaking work, but now we can do things like:
plt.figure(figsize=(10,9))
frame[frame.Country=="USA"]['EthnicityNormalized'].value_counts().plot(kind="pie", label="Ethnicity",autopct='%1.1f%%',
        shadow=True, startangle=45);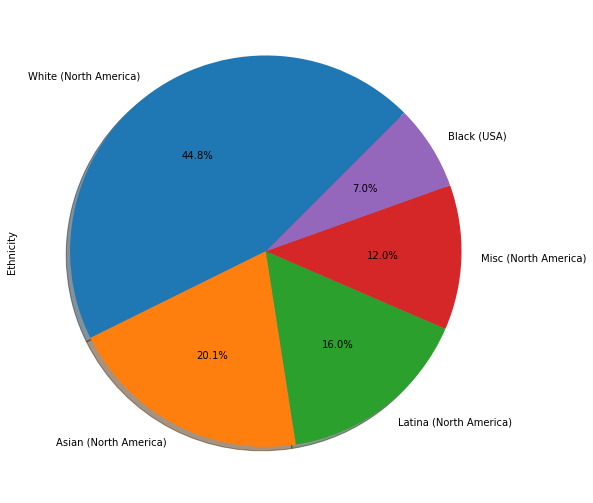
Let’s take a look at Europe. Caveat: this data was provided by Americans visiting Europe mostly, and it only represents a small fraction of the data points (90% refers to the US). In short, it shouldn’t be considered an accurate map of the ethnicity of providers in Europe.
plt.figure(figsize=(10,9))
frame[frame.Country.isin(europe)]['EthnicityNormalized'].value_counts().plot(kind="pie", label="Ethnicity",autopct='%1.1f%%',
        shadow=True, startangle=45);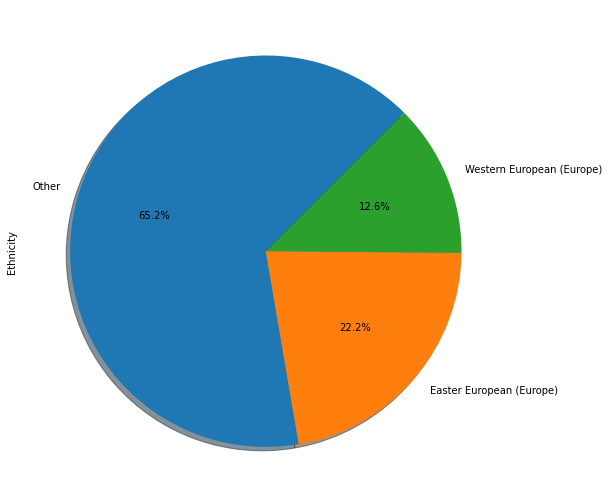
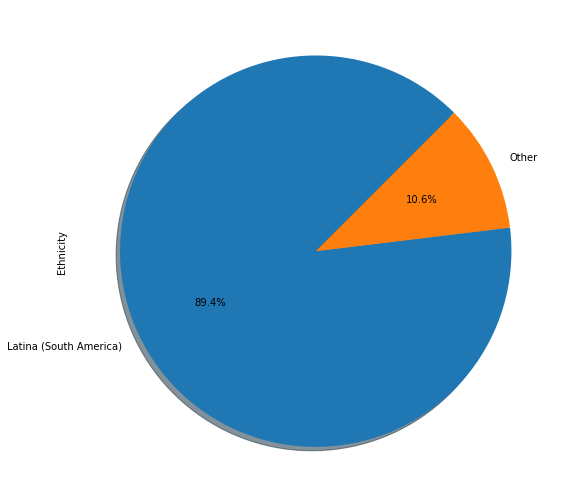
For sake of completeness, a quick look at LATAM won’t hurt, albeit it’s not super significant.
That’s it for Part 2. In the next installment we will look at the services provided by sex workers and correlate them to ethnicity for the hell of it.
